
Demonstrations
Mouse Control via Webcam
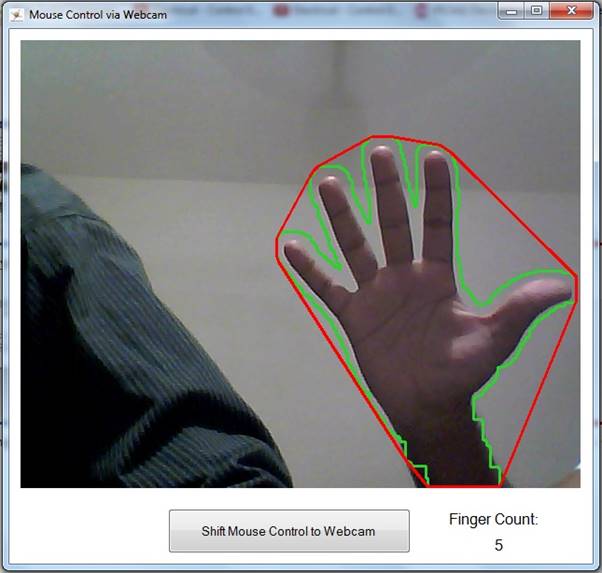
This application image processing, through which we try to recognize hand gestures and control mouse using these gestures. In this app, cursor movement is controlled by the movement of hand and click events are triggered using hand gestures.
Edge Detection in Color Images
Edge detection refers to the process of identifying and locating sharp discontinuities in an image. The discontinuities are abrupt changes in pixel intensity which characterize boundaries of objects in a scene. Classical methods of edge detection involve convolving the image with an operator (a 2-D filter), which is constructed to be sensitive to large gradients in the image while returning values of zero in uniform regions.
This applications demonstrates an edge detection algorithm for general images in color or monochrome. This algorithm uses 1-dimensional lines/functions/textures/images generated from input image to find edges in the image.
Compared to results generated from some known methods, this has marked some unseen edges. The algorithm is adaptive and parameter-izable allowing scope to increase or reduce detail and tolerance. This gives a straight forward approach to refine edges within the image with greater accuracy.
The parameters are mostly visual and observable based on human psychological perception (namely angle, color density, subtraction strategy and detail) rather than existing objective and quantitative methods of mathematical transforms.
Since the algorithm does not use heavy matrix calculations / transforms, it delivers more performance. The algorithm is progressive, as it can be used for noisy signals. It can also be used during progressive loading or partly received image. The algorithm can work with as few linear samples as available or as many.
Existing methods are applied to image as a whole and cannot be applied to different parts of the image with different parameters without breaking the image in different parts and later stitching them back.
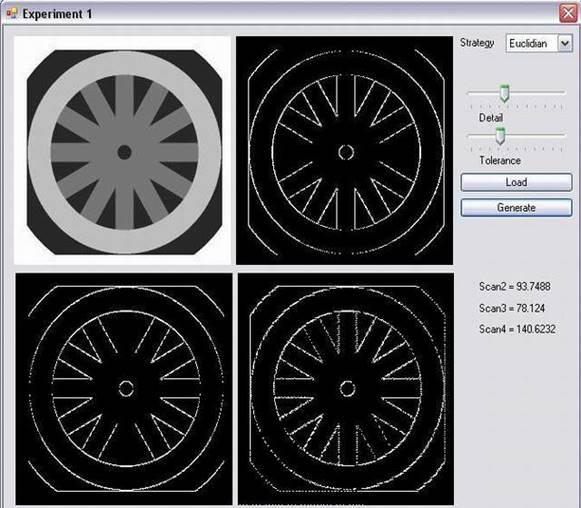
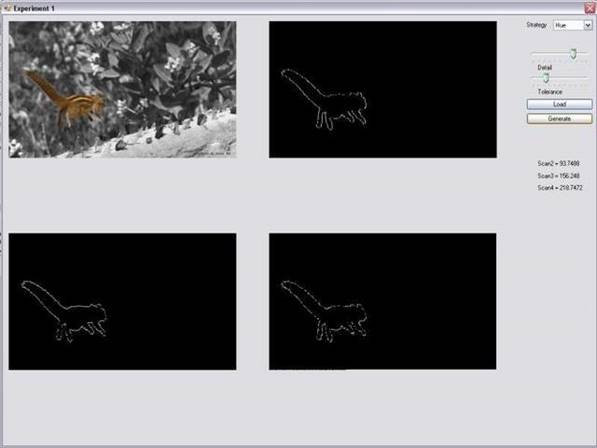
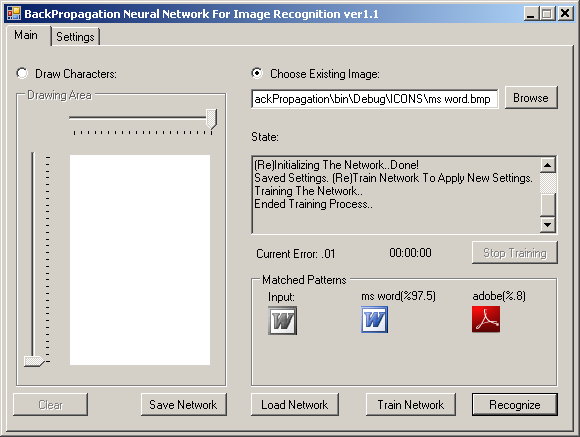
Image Recognition with Neural Networks
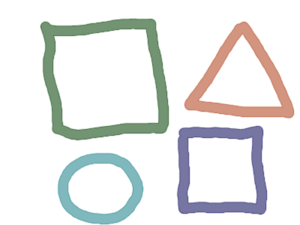
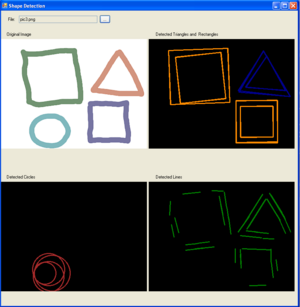
Shape Detection
In this application, we demonstrate Hough Line and Circle detection, as well as using the Image Processing to detect Triangles and Rectangles in the image.
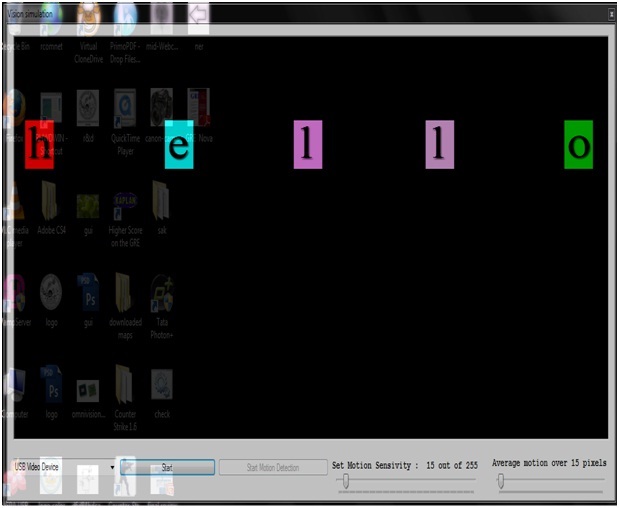
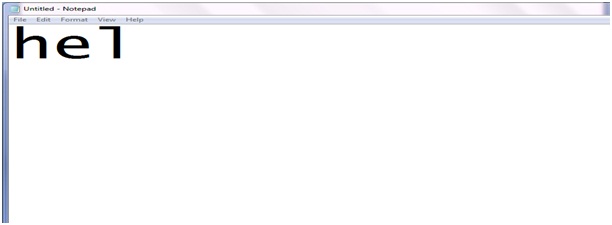
Vision on Virtual Commands
This application is used to show how a computer interacts with a human and converts his/her motion in command actions. It detects motion and converts that motion into the respective command actions.
To detect motion, it uses a simple algorithm of subtracting two images. Every image is made up of three layers: red, blue, and green. Thus, each of the pixels in an image holds three values corresponding to its RGB.
Computer Vision: Virtual Buttons
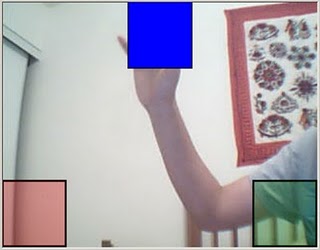
Wouldn’t it be great if you could control your computer with your hands? In this demonstration, you will see a small application to control the Windows Media Player with my hand motion and an ordinary web-cam. You can see the picture above; this application creates three “hot-spots” in the web-cam view, and you can assume that these hot-spots are virtual buttons, and they get activated when you make a click movement in them.
BotZilla
A chatterbox application with speech synthesis and speech recognition tacked on to it. Demonstrating how to build increasingly sophisticated recognition rules.
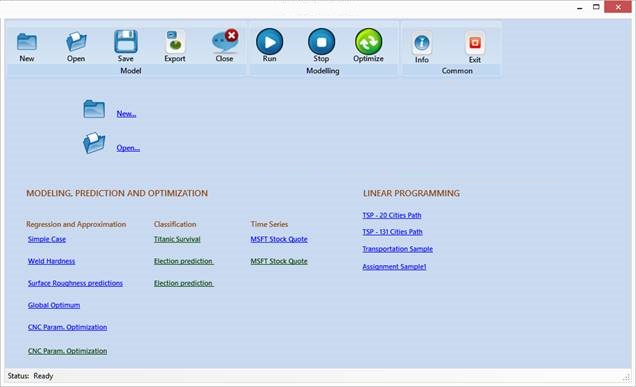
GN Dashboard – artificial intelligence tool
GA Dashboard is an artificial intelligence tool for applying Genetic Algorithm and Artificial Neural Networks in modeling, prediction, optimization and pattern recognitions. With GN Dashboard you can solve various engineering problems from classic regression and approximation to linear programming transportation and location problems and other machine learning based problems. By providing the learning algorithms GN Dashboard uses a data of the research or experimental measures to learn about the problem. The results of learning algorithms are analytical models which can describe or predict the state of the problem, or can recognize the pattern. GN Dashboard is very easy to use, even if you have no deep knowledge of GA, GP or ANN, you can apply those methods in finding solutions. The tool can be used in modeling any kind of engineering process, which can be described with discrete data, as well as in education during teaching students about evolutionary methods, mainly GP and GA, as well as machine learning mainly Artificial Neural Networks.
The typical process of modelling with GN Dashboard can be described in 5 steps.
- Choosing the Solver Type: The first step is choosing the type of the solver. Which solver you will use depends on your intention what you want to do. For example if you want to make model for your experimental measurement you have several options which depend of your experimental data and the method you want to use. In GN Dashboard you can use Genetic Programming or Neural Nets for modelling and prediction experimental data. But this is not strictly separate as may look on the flowchart below. That means that you can user Neural Networks for prediction, but training algorithm can be based on Genetic Algorithm or Particle Swarm Optimization or Back Propagation algorithm.
- Loading Experimental Data: GN Dashboard uses powerful tool for importing your experimental data regardless of the type of data. You can import your numerical, binary or classification data. GN Dashboard can automatically define classes, or format numerical data with floating or comma separated decimal values.
- Setting Learning Parameters. After data is loaded and prepared successfully, you have to set parameters for the selected method. GN Dashboard providers various parameters for each method, so you can set parameters which can provides and generates best output model.
- Searching for the solution: GN Dashboard provides visualization of the searching solution so you can visually monitor how GN Dashboard finds better solution as increasing the iteration number. If you provide data for testing calculated model, you can also see simulation of prediction.
- Saving and exporting the results: GN Dashboard provides several options you can choose while exporting your solution. You can export your solution in Excel or text file, as well as in Wolfram Mathematica or R programming languages.
As can would be seen, working in GN Dashboard follows the same procedures regardless of the problem type. That means you have the same set of steps when modelling with Genetic Programming or Neural Networks. In fact GN Dashboard contains the same set of input dialogs when you try to solve Traveling Salesman Problem with Genetic Algorithm or if you try to solve handwriting recognition by using Backpropagation Neural Networks. All learning algorithms within GN Dashboard share the same UI.
Besides parameters specific to learning algorithm, GN Dashboard provides set of parameters which control the way of how iteration process should terminates as well as how iteration process should be processed by means of parallelization to use the multicore processors. During the problem searching GN Dashboard records the history, so you can see when the best solution is found, how much time pass since last iteration process start, or how much time is remain to finish currently running iteration process.
Due to the fact that GP is the method which requires lot of processing time, GN Dashboard provides parallelization, which speed up the process of searching. Enabling or disabling the parallelization processing is just a click of the button.