
Demonstrations
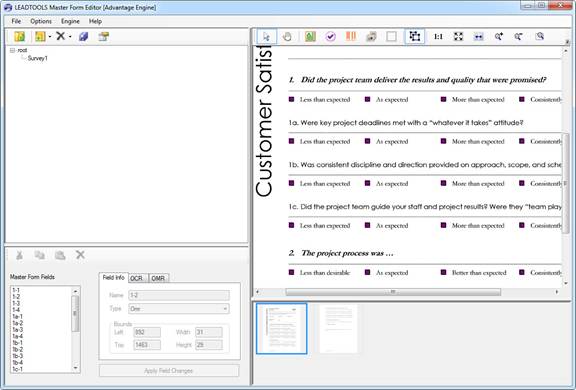
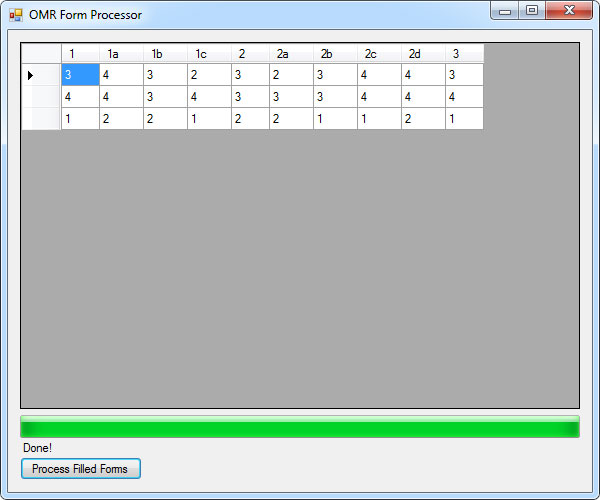
Optical Marks Recognition (OMR) Engine
OMR ( wiki ) are answer sheets that are not intended to be read by a human being. This projects eliminates the need to buy OMR reading machines and even a photo scanner for computer. Any 2MP< mobile phone camera with autofocus will do the job.
Forms recognition and processing is used all over the world to tackle a wide variety of tasks including classification, document archival, optical character recognition and optical mark recognition. Out of those general categories, OMR is an oft misunderstood and underused feature in document imaging due to the time required to set up OMR based forms and the difficulty of accurately detecting which OMR fields are filled on a scanned document. Creating and processing OMR forms can be a time-consuming nightmare and this white paper will discuss how to alleviate those issues through automated detection, classification and processing.
Most forms contain a small number of OMR fields to capture information such as gender and marital status. These cause little to no difficulties because there are very few fields to deal with. On the other hand, creating and processing forms dominated by multiple choice questions is noticeably more difficult due to the sheer volume of fields that can be packed into a page. Additionally, the small size of check boxes, bubbles and other types of OMR fields creates potential hypersensitivity resulting in more false negatives or positives.
Below we will examine in more detail how to alleviate both of these common problems by developing an OMR forms recognition application with LEADTOOLS. This award-winning imaging SDK contains all the tools necessary to combine time-saving and programmer friendly APIs with state of the art recognition accuracy and speed for an unmatched level of quality in your final solution.
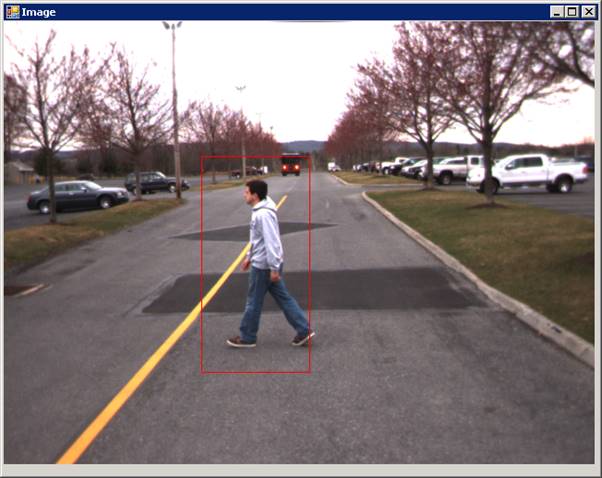
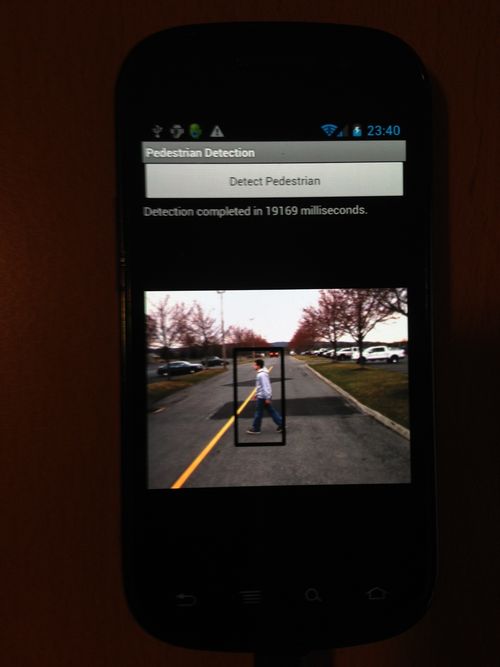
Pedestrian Detection
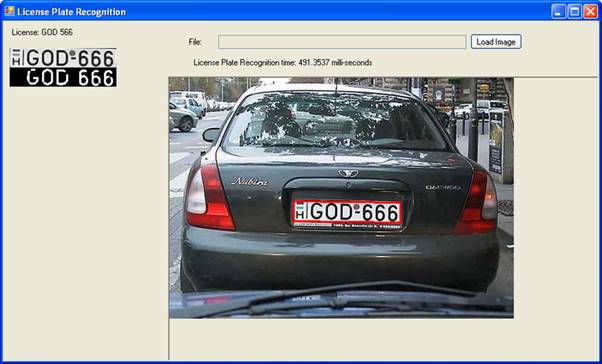
License Plate Recognition
According to wikipedia
Automatic number plate recognition (ANPR; see also other names below) is a mass surveillance method that uses optical character recognition on images to read the license plates on vehicles. As of 2006, systems can scan number plates at around one per second on cars traveling up to 100 mph (160 km/h).[citation needed] They can use existing closed-circuit television or road-rule enforcement cameras, or ones specifically designed for the task. They are used by various police forces and as a method of electronic toll collection on pay-per-use roads and monitoring traffic activity, such as red light adherence in an intersection.
ANPR can be used to store the images captured by the cameras as well as the text from the license plate, with some configurable to store a photograph of the driver. Systems commonly use infrared lighting to allow the camera to take the picture at any time of the day. A powerful flash is included in at least one version of the intersection-monitoring cameras, serving both to illuminate the picture and to make the offender aware of his or her mistake. ANPR technology tends to be region-specific, owing to plate variation from place to place.
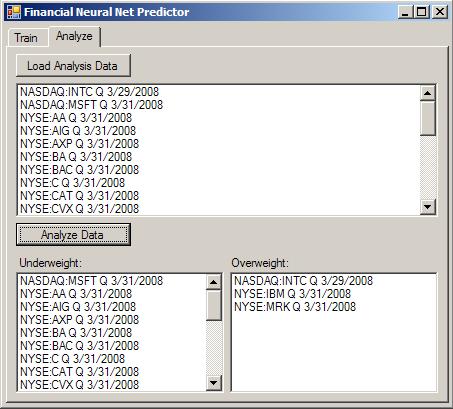
Financial Net Predictor
Financial Net Predictor is an sample application with the goal of providing advanced Artificial Intelligence, Statistical and Mathematical tools for amateur and sophisticated investors. Financial Net Predictor can be a complete algorithmic trading platform with comprehensive AI and Quantitative Finance libraries. The platform will also deliver high performance.
Predictor is a tool that uses financial statements, income statements, balance sheets and cashflow statements and creates powerful pattern classifiers based on that data. Then it uses the classifiers to predict financial performance.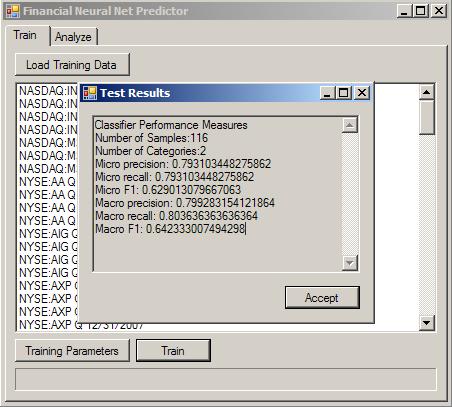 .
. 
The sample uses quarterly or yearly financial statements of big cap companies to predict the performance of its stock, one quarter or one year ahead. And in order to do that it uses a two layer perceptron.
A porfolio composed only of the three stocks identified as Overweight by Predictor in March, 31st would have a performance considerably better than the SP500. The following chart shows the relative gains. Predictor beats the SP500 by more than 5 points.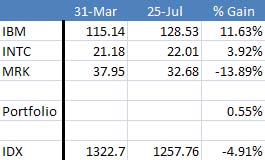
Partial Least Squares (PLS)
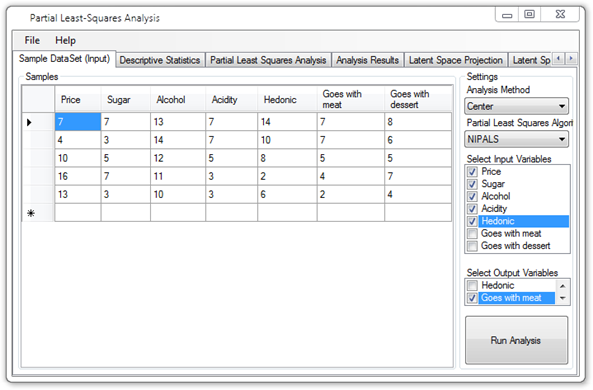
Demonstrates how to use Partial Least Squares to fit a (multiple and multivariate) linear regression model from high-dimensionality data.
Linear and Logistic Regression Analysis
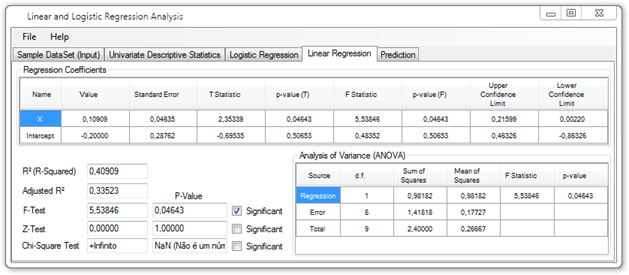
Sample application for creating and fitting Logistic Regression models. Also fits a multiple linear regression model for comparison purposes, and performs chi-square tests and computes Wald’s statistics for the logistic regression coefficients.
Receiver Operating Characteristic (ROC) Curves
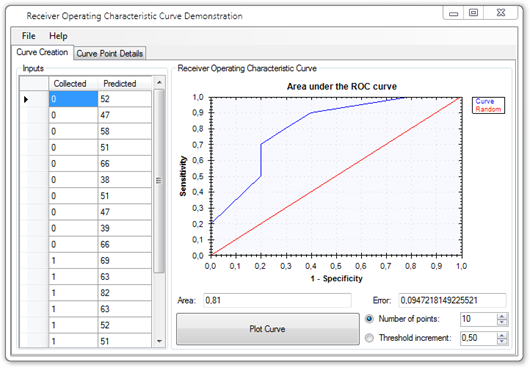
Sample application demonstrating how to create and visualize Receiver-Operating Characteristic Curves from a given set of results from a test or a classification process.
Cox’s Proportional Hazards
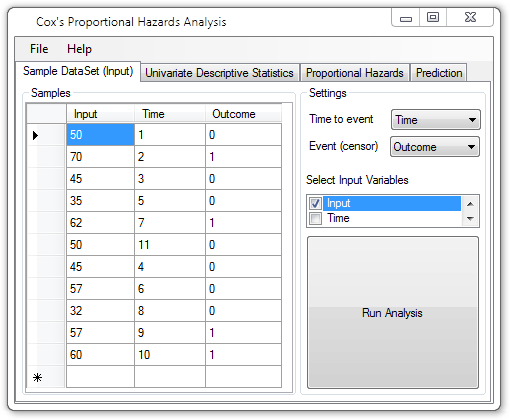
How to perform survival analysis using Cox’s Proportional Hazards model for both regression and prediction of time-censured data.
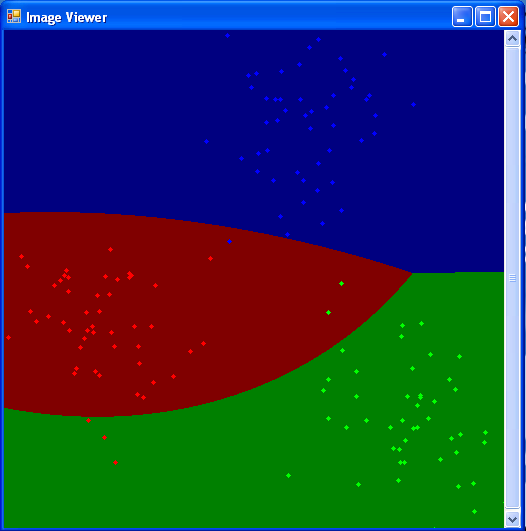
Normal Bayes Classification
What is a Normal Bayes Classifier
A Normal Bayes Classifier is also known as the Naive Bayes Classifier.
According to wikipedia
A naive Bayes classifier is a term in Bayesian statistics dealing with a simple probabilistic classifier based on applying Bayes’ theorem with strong (naive) independence assumptions. A more descriptive term for the underlying probability model would be “independent feature model”.
In simple terms, a naive Bayes classifier assumes that the presence (or absence) of a particular feature of a class is unrelated to the presence (or absence) of any other feature. For example, a fruit may be considered to be an apple if it is red, round, and about 4″ in diameter. Even though these features depend on the existence of the other features, a naive Bayes classifier considers all of these properties to independently contribute to the probability that this fruit is an apple.
Depending on the precise nature of the probability model, naive Bayes classifiers can be trained very efficiently in a supervised learning setting. In many practical applications, parameter estimation for naive Bayes models uses the method of maximum likelihood; in other words, one can work with the naive Bayes model without believing in Bayesian probability or using any Bayesian methods.
In spite of their naive design and apparently over-simplified assumptions, naive Bayes classifiers often work much better in many complex real-world situations than one might expect. Recently, careful analysis of the Bayesian classification problem has shown that there are some theoretical reasons for the apparently unreasonable efficacy of naive Bayes classifiers. [1] An advantage of the naive Bayes classifier is that it requires a small amount of training data to estimate the parameters (means and variances of the variables) necessary for classification. Because independent variables are assumed, only the variances of the variables for each class need to be determined and not the entire covariance matrix.
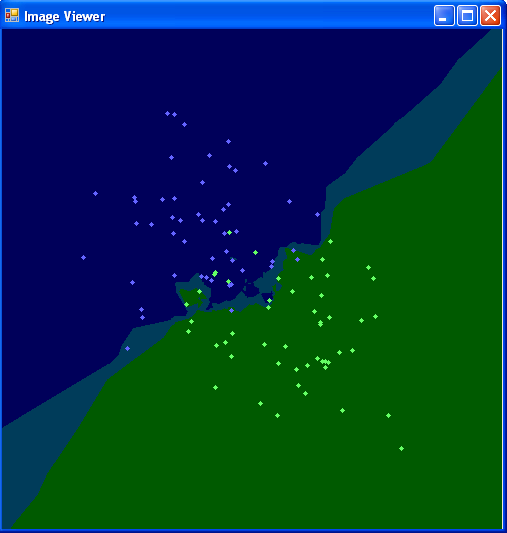
K Nearest Neighbors
What is a K Nearest Neighbors Classifier
According to wikipedia,
In pattern recognition, the k-nearest neighbors algorithm (k-NN) is a method for classifying objects based on closest training examples in the feature space. k-NN is a type of instance-based learning, or lazy learning where the function is only approximated locally and all computation is deferred until classification. It can also be used for regression.
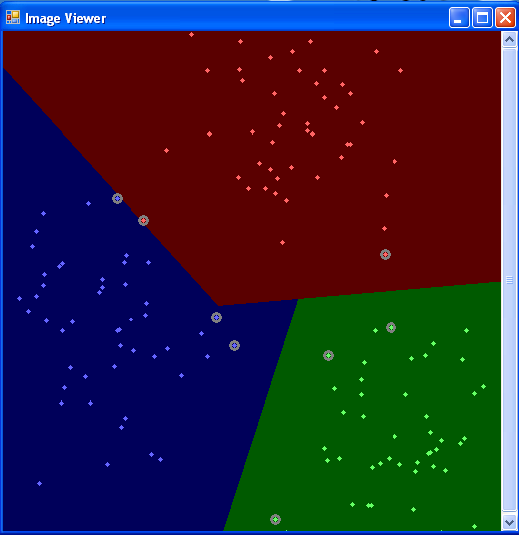
SVM (Support Vector Machine
What is a Support Vector Machine
According to wikipedia,
Support vector machines (SVMs) are a set of related supervised learning methods used for classification and regression. Viewing input data as two sets of vectors in an n-dimensional space, an SVM will construct a separating hyperplane in that space, one which maximizes the margin between the two data sets. To calculate the margin, two parallel hyperplanes are constructed, one on each side of the separating hyperplane, which are “pushed up against” the two data sets. Intuitively, a good separation is achieved by the hyperplane that has the largest distance to the neighboring datapoints of both classes, since in general the larger the margin the lower the generalization error of the classifier.
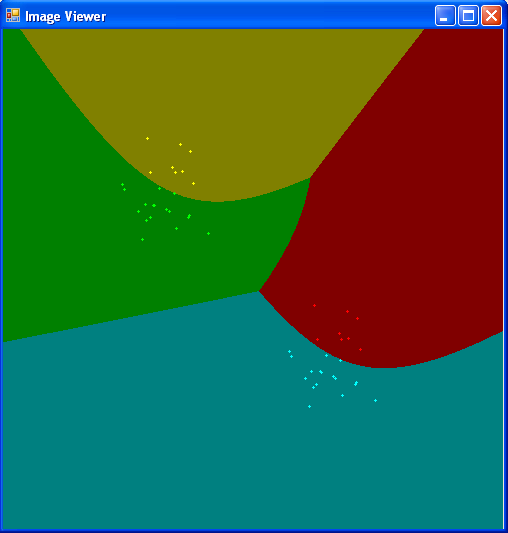
Expectation-Maximization
What is an Expectaion-Maximization Classifier
According to wikipedia,
An expectation-maximization (EM) algorithm is used in statistics for finding maximum likelihood estimates of parameters in probabilistic models, where the model depends on unobserved latent variables. EM is an iterative method which alternates between performing an expectation (E) step, which computes an expectation of the log likelihood with respect to the current estimate of the distribution for the latent variables, and a maximization (M) step, which computes the parameters which maximize the expected log likelihood found on the E step. These parameters are then used to determine the distribution of the latent variables in the next E step.
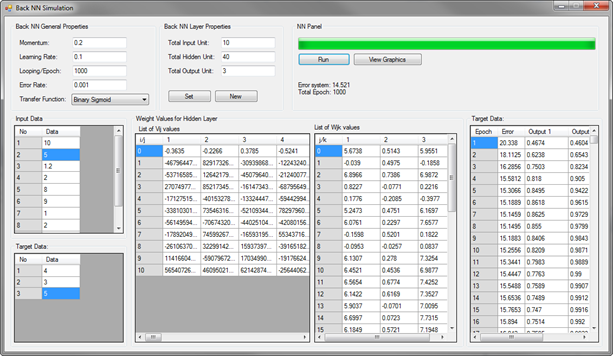
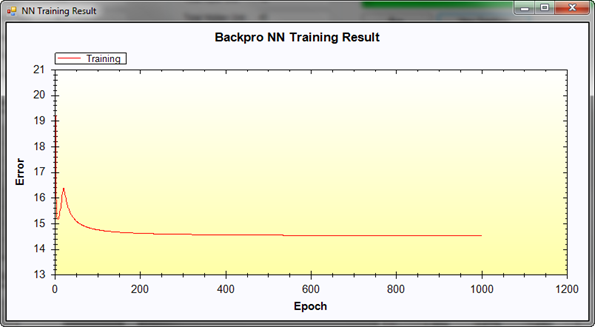
Back-Propagation Neural Networks Simulation
This is simple Back-Propagation Neural Network simulation
Classification (Kernel SVM)
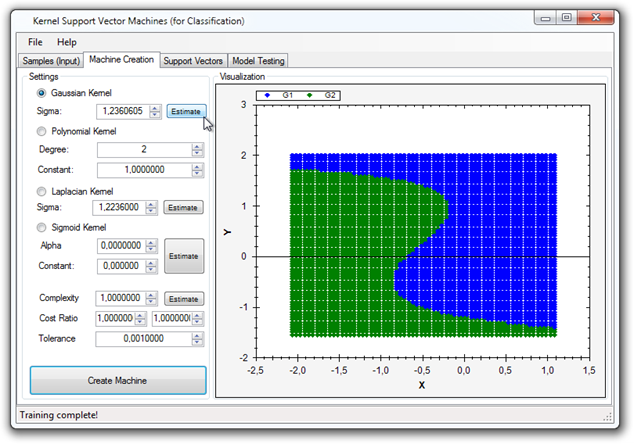
Data classification using (Kernel) Support Vector Machines.
Classification (Naive Bayes)
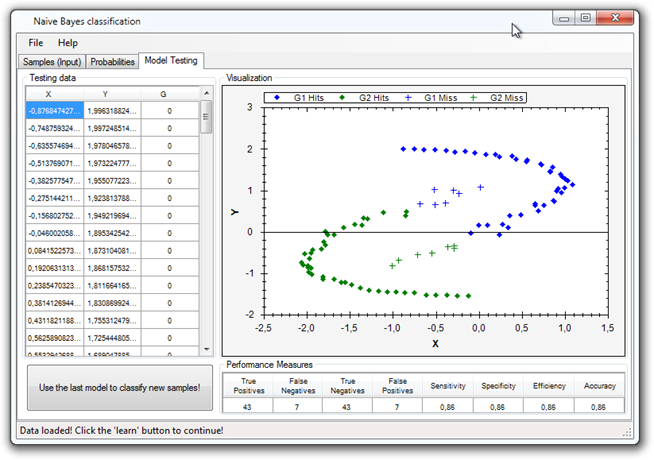
Data classification with the Naive Bayes classifier.
Classification (Decision Trees)
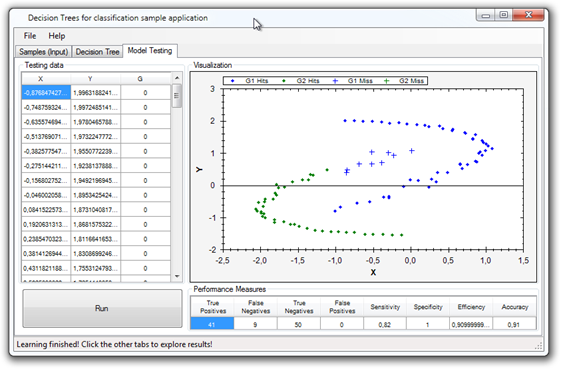
Decision tree learning with ID3 and C4.5 algorithms.